


Facebook and Instagram for an online store of designer goods with ROMI 221%
This article was translated automatically. We are working over improving the translation.
Please send your questions about the article to info@intervolga.ru
Project history
The client is a large online store of designer furniture and interior items. Basically, these are high-priced designer products. But the assortment is so different that in the same catalog for 16,000 items, trinkets for 300 rubles and a dinner table for 800,000 rubles are side by side.
According to the statistics of the last 3 months, the average order amount is 16 570 rubles. Online store revenue is about 11 million rubles a month.
Target audience of the client:
-
interior designers;
-
wholesale buyers;
-
final consumers: people of high and medium income, often residents of elite cottage settlements;
-
owners of restaurants and cafes.
There are several advertising channels in the work: contextual and targeted advertising.
In the article we will look at Facebook and Instagram. Work on them allowed us to apply interesting targeting in combination with specially selected content and achieve an increase in ROMI by 3 times.
Analysis
How does effective advertising on Facebook begin? That's right, with the analysis.
We investigated traffic from Facebook and Instagram ads for the year from 03/01/2016 to 03/31/2017.
-
costs: ~ 870 666 rubles
-
orders: 95 pcs. in the amount of 3 735 808 rubles
The analysis process was not smooth:
-
the call tracking system was not yet available to the client;
-
UTM tags were not placed everywhere (therefore, the data on the report was viewed by Advertising Systems);
-
clicks in the advertising office significantly exceeded the number of visits to the Metric.
We installed our e-commerce module and set up analytics again.
Having dug deeper, we realized that significant orders were only during the winter sales:
|
|
Dec 2016 |
Jan 2017 |
|
Orders, pcs |
13 |
13 |
|
Amount, rub |
1 840 496 |
651 500 |
November and February in sales were worse than the New Year SALE - 599,234 and 197,098 rubles, respectively. The remaining months, according to web analytics, gave sales an average of 150 thousand rubles.
On the New Year, sales are taking off at everyone, each store is trying to surprise the customer with discounts, assortment, special conditions, play on the holiday fever.
We recommend separating regular and festive months when analyzing effectiveness.
Judge for yourself - it's very easy to photograph at least Nikon, at least on an iPhone, at least on a matchbox, if it's sunny and bright beauty poses on the sand of Bounty Island. It is quite another thing when at 9 pm on an autumn rainy day you try to capture someone resembling a Twilight character.
And in photography, and marketing - you need a pro with the supplied equipment and work experience.
It's easy to make cool KPIs on New Year's 80% sale with a cool product. Try to show the result without discounts on regular products in the low season. In May, when everyone cooks kebabs and in June, when the head is filled only with vacation :)
And what if there is no global sales with a plague assortment? Squeeze out of advertising to the maximum, optimizing costs!
Correct setting of advertising on Facebook and Instagram
Tasks assigned:
-
Reduce the price of the order;
-
Increase ROMI;
-
Test targeting and identify the best and worst;
-
Build an optimal advertising structure.
If you write the history of this case with large strokes, then we:
-
developed a UTM tagging system
-
identified the main target for targeting by gender, age, geography
-
created various advertising audiences: by interests, positions, consumer profile, set up retargetings, filled the bases and created look-alike audiences
-
made a media plan of advertising content regarding the settings: product collections, banners for product categories, sales, target audience
-
tested the settings
-
reduced the cost of a click and sales
-
constantly analyzed the results and made adjustments
-
We constantly worked on optimizing advertising campaigns and achieved our goals.
Now we will tell about our work.
Development of a single map UTM-tags
The UTM label card is needed to test a large number of settings in combination with various content. The structure of the utm - label looked like this:
-
utm_source - placement, for example Facebookcpc = Facebook feed, pay per click;
-
utm_medium - the content of the advertising campaign, for example, sale_20april = Sale on April 20;
-
utm_content - ad content, for example, common = general ad;
-
utm_campaign - campaign, for example cottage_mix = geotargeting for several top cottages. Determination of the main target audience for targeted advertising.
Determination of the main target audience for targeted advertising
The settings for gender, age, city are in all targeted systems in social networks. By limiting impressions on them, you can save a lot. Especially if you are going to test a lot of new settings. The only place where you can do without restrictions is retargeting. Here you can take the entire audience, but do separate retargeting RK with a different set of gender / age / region.
Targeting by gender and age
Go to the standard report Metrics and see the audience, which often makes purchases:
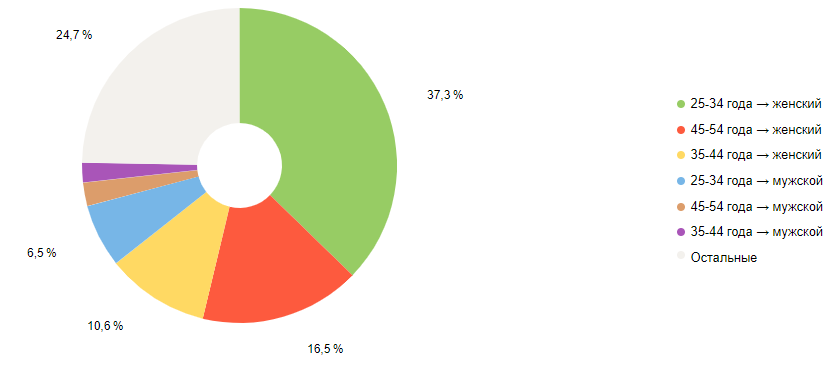
*Screenshot of sales by sex and age for all types of traffic
The data coincided with the vision of the client.
For our Republic of Kazakhstan, we chose the core of the audience - women 25–45 years old.
As a test, we also launched advertising campaigns for men aged 25-45.
Since it was a kind of risk, we took only those targeting that brought conversion from women. To hit the target, we also picked up special products and banners, which enjoyed success with a small male audience of the site.
We understood that we were moving in the right direction: the amount of orders increased compared with the previous period.
Geo targeting
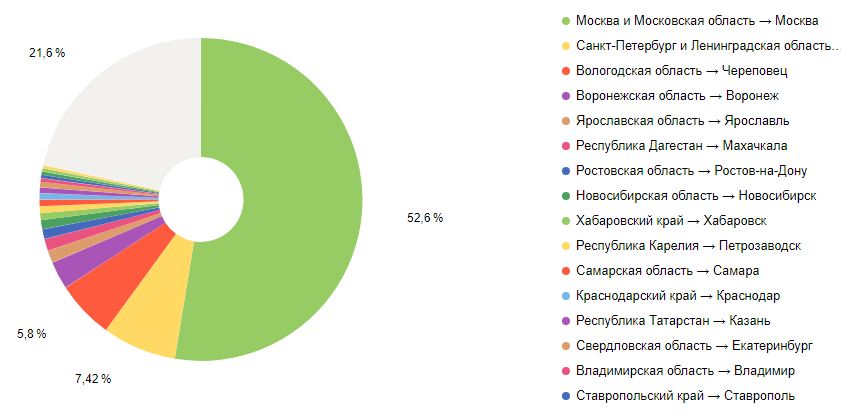
* Screenshot of sales from different regions for all types of traffic
The online store works throughout Russia, but the main sales are in Moscow.
We immediately divided advertising campaigns into 2 geotargeting - Moscow, Russia (for some retargeting RKs). A larger advertising budget was on RK in Moscow.
Then, as a test, we decided to launch separate advertising campaigns on Sochi and St. Petersburg. For testing, we chose successful targeting settings that brought the most orders in Moscow. Unfortunately, it did not bring sales in Sochi and St. Petersburg, they turned off test RK.
Before you begin setting up advertising, examine the portrait of the target audience for all types of traffic. Perhaps data on geography and other important indicators can be downloaded from CRM.
Creating advertising audiences in facebook
-
geo-targeting with a radius of 1 km to shopping centers: Twinstore, Expostroy, Art Play, Rumer, 3 Whales;
-
geo-targeting for elite cottage villages. List provided by customer;
-
Targeting by interest
-
job posting (example: interior designers) and areas of study (interior design);
-
retargeting: by sections of the site, by stages of the sales funnel and by those who added products to favorites;
-
audience on the basis of phone numbers and email database. And similar audiences (Look-ALike);
-
targeting communities of competitors;
-
income targeting: Facebook spending, lifestyle, etc.
Infographic advertising structure
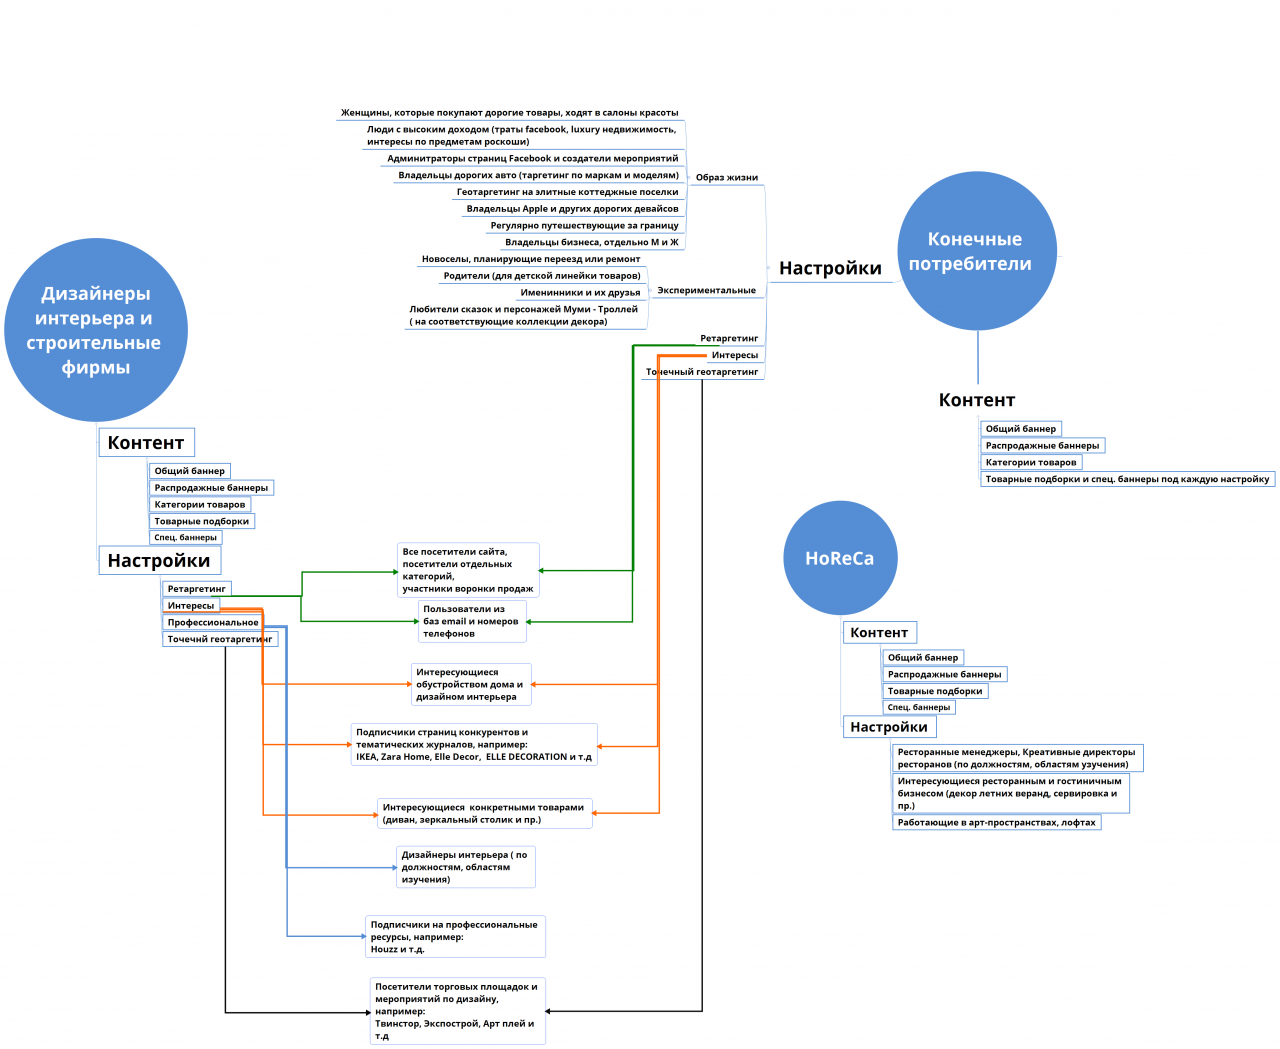
It is important to test various ad-tuning combinations. The narrower the audience, the more accurate the advertising message should be. Therefore, we do not recommend dispensing with the same ad for all audiences.
Media Planning Advertising Content
We selected our content for various settings.
For example: for male businessmen, these were collections of office desks, business card holders, etc.
For restaurateurs - posters, trays, the decor of the hall, etc.
For women with a high level of wealth, accustomed to constantly looking after themselves - floor-standing mirrors, jewelry boxes, dressing tables, etc. Efficiency depended not so much on setting as on the content itself.
Testing showed that the CTR (clickability of the ad) and the conversion on the site were higher in banners and collections, where we showed the goods in the interior. Using the product photo on a white background gave the worst result and the clicks were more expensive.
Testing settings and advertising optimization on Facebook and Instagram
Stages of development of the Republic of Kazakhstan:
-
We chose to target;
-
Designer painted banners;
-
Unloaded the TOP of goods according to the accounting system for the segment;
-
Launched a campaign for the week;
-
Analyzed costs and sales according to web analytics;
-
Decided:
-
Campaigns for which there was good traffic and the amount of orders exceeded expenses, we left in the work. Either with the same price per click, or raised.
-
Campaigns for which there were no orders, but there was a good promising traffic, we left in the work, reduced the cost of a click to a minimum of 10 - 20 cents.
-
If the campaign did not bring any traffic or orders, we turned it off and did not use it.
Bid Management
Previously set up ad campaigns did not have a clear betting logic. Bidding strategy was automatic. Price per click from 1 cent to 1.5 dollars. Daily budget from 20 to 100 dollars.
Since the automatic bidding strategy cannot be controlled, we chose a manual strategy and focused on advertising campaign indicators. For all new campaigns, we set a price per click of 50 cents and a budget of $ 5 per day. After testing, the strategy of rates and expenses was assigned to each RK.
Click Price Reduction Chart:
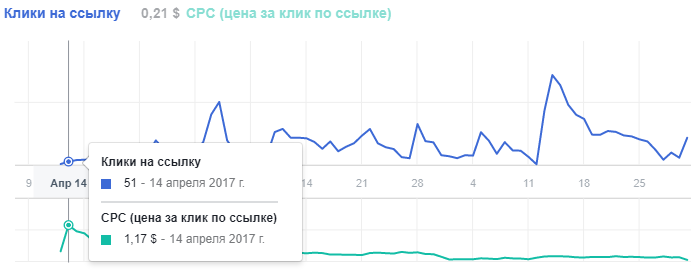
The cost per click decreased from $ 1.17 to $ 0.07, while the amount of traffic was not affected, and ROMI increased. More on this in the “results” section.
Analysis and optimization
Project web analytics system
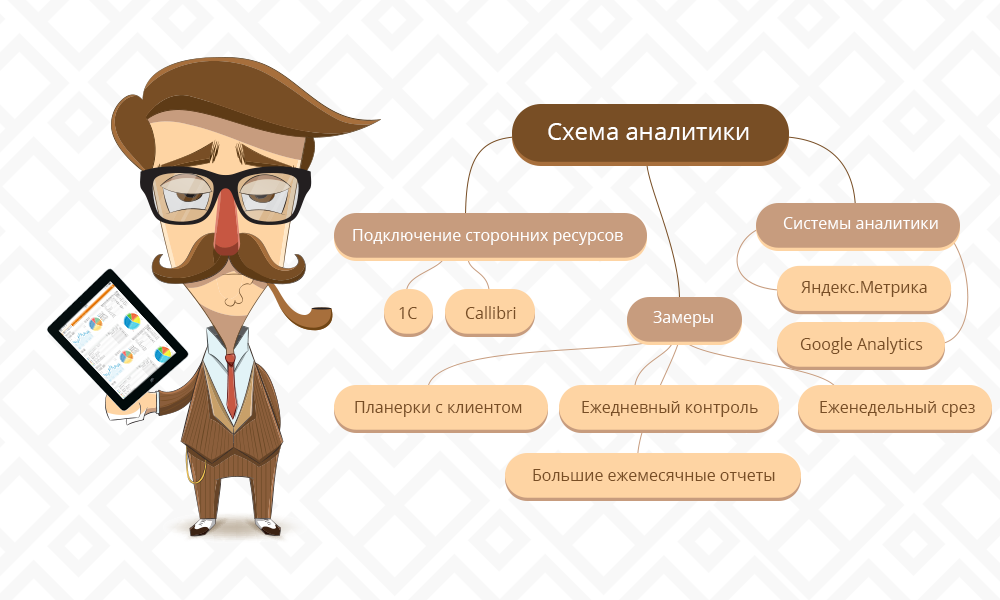
-
Improving performance without tracking is not possible. Therefore, we have introduced a monitoring system with constant optimization of labor costs and budget regulation:
-
fixing completed tasks based on time;
-
constant monitoring once a week and unscheduled surveys of sales peaks or drops;
-
tracking results by UTM tags;
-
listening to calls in Callibri;
-
reconciliation with the accounting system (1C).
Task scheduling was very flexible. We always understood what to spend more time and money on, and what should be discarded.
Analytics tools have fixed orders. Further, the data came in the accounting system. At the exit, we received paid orders.
After getting orders to the site there were losses. This is a normal practice faced by any online store. This is due to errors in the service process or simply because the buyer changed his mind. Since the actual payments differed from the amount of orders in the accounting system, we climbed deep into the sales funnel.
Sales Funnel Study
We conducted a sales funnel survey in about two months on a sample of 319 orders. If we accept data on orders in the Metric for 100%, then the accounting system received 82% of the order, and as a result only 33% of the orders from the Metric data were paid.
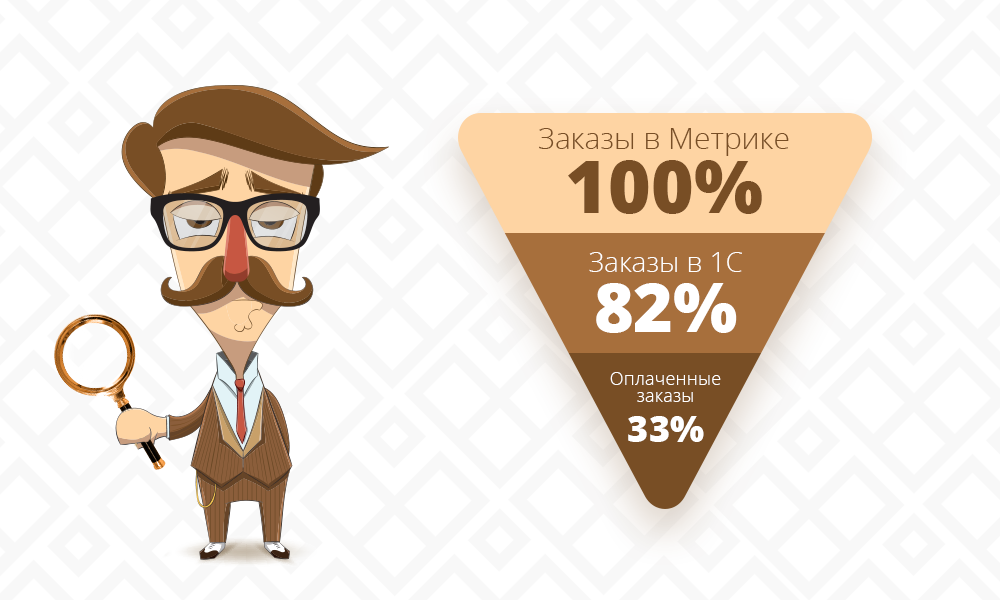
As can be seen from the sales funnel, 67% of orders were never paid. It was necessary to understand why there is such a loss of orders.
After getting orders in the accounting system managers contacted buyers. According to the data of listening to calls, we learned that:
-
more than half of the questions about the availability of goods had a negative answer, even if the site showed the presence;
-
delivery time in reality was almost always longer than that voiced on the site (30-60 days if the goods were not in stock).
Analysis of listening to calls on advertising traffic in Callibri gave the following funnel: out of 213 calls, 18 orders were received for the amount of 900,009 rubles according to data from 1C (these data were not included in the analytics system, the managers made out orders themselves).
As a result of the analysis of the sales funnel, we conclude that there are flaws on the website of the online store on the client’s side. The client agreed that there is something to work on and that the number of paid orders can be increased if we correct the flaws on the site.
It is necessary to accurately track the availability of goods on the site and write the correct delivery information so as not to mislead customers. When choosing a product for advertising is to focus on the availability and delivery time.
TOP best and worst settings and ads
Settings that work well:
-
Targeting the interests of interior design;
-
Common interests (Shopping, furniture, etc.);
-
Targeting sections of the site mirrors and interior;
-
General retargeting;
-
Interest home improvement.
Such advertising content works best:
-
Product collections;
-
General sale announcement (terms and conditions of sale);
-
Sale ad for categories of mirrors and interior.
A higher percentage of failures and fewer sales at the settings:
-
Geo-targeting for cottage settlements and marketplaces;
-
Targeting men 25 - 45 years old (although they used the settings that gave sales to women);
-
Regions except Moscow: in particular, St. Petersburg and Sochi;
-
Competitor tagging;
-
Retargeting by Metric Objectives:
-
Put in the basket, but not bought;
-
Visitors to the site 30 days ago;
-
Visitors to the site 180 days ago.
Most ineffective ads:
-
General announcement (brand presentation);
-
Sale announcement on the category of light and tableware.
Analytics using only one system never gives 100% accurate data. To increase forecast accuracy: analyze all data available to you.
When we evaluated the results, for each setting, we counted the number of calls on Callibri, the amount of sales on the Metric, the actual sales on the accounting system.
Not all settings were for sale. A common reason for this is not enough traffic for a correct sample.
When there was little traffic on setting up, we evaluated its prospects for participation in conversion paths (report in Google Analytics) and considered the achieved goals: add to cart, to favorites.
This approach allows you to constantly optimize the performance of advertising.
Results and conclusions
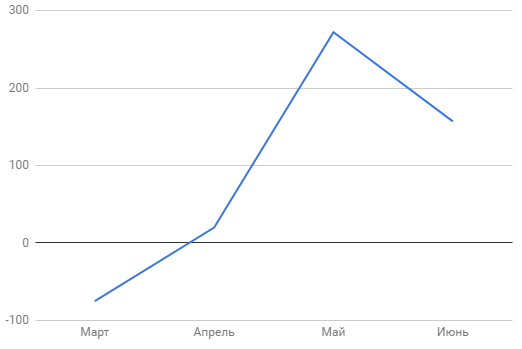
We wanted to look at the data in dynamics and made a comparison of 5 periods. For sales data they took orders from e-commerce without conversion to real payments and without phone sales. Advertising investments were taken without the cost of work.
|
Period**, 2017 |
Amount orders, pcs |
Spent budget |
Sales by data web analytics* |
Order price (expenses / number of orders) |
ROMI, % |
|
Mar 2017 |
1 |
113 877 |
28 140 |
113 877 |
-75 |
|
1 - 19 Apr 2017 |
- |
36 047 |
- |
- |
- |
|
20 - 30 Apr 2017 (we started working) |
5 |
26 846 |
78 720 |
5 369 |
193 |
|
May 2017 |
14 |
160 991 |
599 345 |
11 450 |
272 |
|
Jun 2017 |
8 |
116 938 |
301 534 |
14 617 |
157 |
*data from the UTM Tag Metrics report
**We started working with the client’s advertising channels from 04/20/2017.
As a result of the work done, we achieved the goal:
-
Reduced the price of the order from 113,887 to 14,617 rubles;
-
Increased ROMI from -75 to 157%.
And solved the following tasks:
-
Tested the targeting and identified the best and worst;
-
Built an optimal advertising structure.
Calculation formula ROMI:
ROMI = (Web Analytics Sales - Budget Expenditures) / Budget expenditure * 100%
ROMI (for the period of our work 04/20/2017 - 06/30/2017) = (979 599 - 304 775) / 304 775 * 100% = 221%
Payback on Facebook and Instagram
So was advertising on Facebook and Instagram effective for business? Calculate the period of our work: from 04/20/17 to 06/30/17.
Take into account:
-
research data that approximately 33% of orders from an e-commerce report are paid, i.e. amount in cash ~ 212 564 rubles;
-
Callibri data: out of 18 paid orders that were not counted in the Metric, there were 4 from Instagram worth 115,004 rubles, for a total of 327 568 rubles;
-
according to the data provided by the customer, the average product margin is 27%, i.e. the cost of 73% = 260 002 rubles;
-
The cost of our work on this source was 50,433 rubles, together with the budget it is 356,167 rubles.
Calculate ROI =(Amount of paid orders - Net Cost) / Marketing costs * 100%
ROI = (327 568 - 260 002) / 356 167 * 100% = 18,97 %
Since the figure is less than 100%, the investment has not paid off.
Conclusion: whatever the quality traffic, only part of the sales that you see in the Metric (besides the existing data error) can reach the end of the funnel. In our case, paid a third of incoming orders.
To improve payback, you need to work through all stages of the sales funnel and all the business processes of the company. Otherwise, it is dangerous to increase the advertising budget and conduct global experiments.
Targeted advertising on Facebook: do or be afraid?

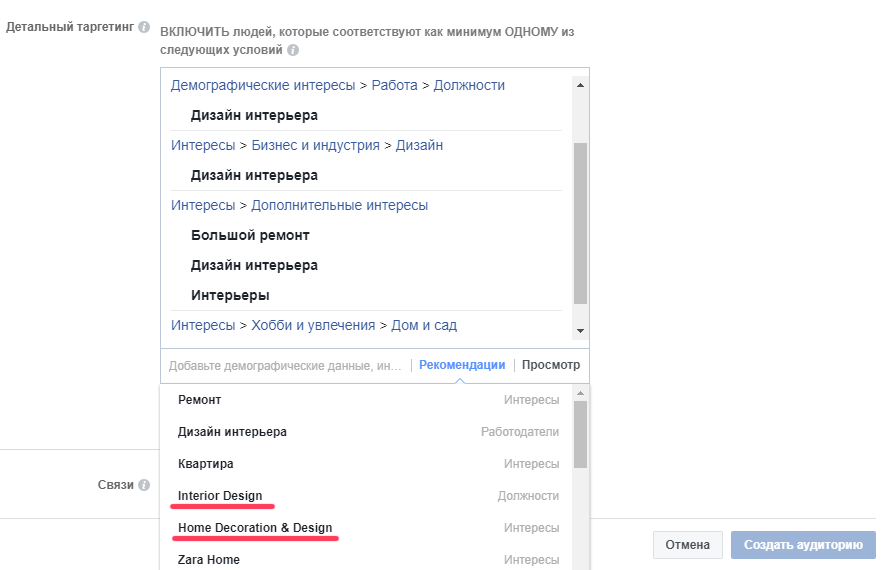
1. Facebook has unobvious customization features:
1.1 creating a set of interests on any topic, you can see in the recommended quite interesting targeting. Sometimes you have to spend hours choosing such combinations of targeting, so that the right option comes up in the recommended ones;
1.2 If you enter the names of competitors, especially if they are large, you can come across the fact that they are on the target lists. Those. The audience of competitors' subscribers can be used to customize the audience, this is valid only for large pages. But even in this case, it is necessary to go in order from the most important to the less suitable targeting, otherwise the necessary ones may disappear from the list of recommended ones, and you can often not find them manually;
1.3. Facebook slips overseas targeting in English in recommended. They should be added to the Russian-speaking audience last, otherwise only the foreign audience will be selected soon:
1.4. if you don’t update your audience or use a new one, Facebook will try to show ads to those who have already responded to it. In a few months, the effectiveness of advertising will significantly decrease. And if you do not exclude the current audience of your account, then advertising will be shown most often to your subscribers;
1.5. If you run ads on all places of shows at once, the lion's share of expenses will be on Instagram. People react more actively to advertising on Instagram, more often there are occasional clicks than on Facebook. As a result, the advertising system will try to show ads on Instagram. In the Audience Network advertising system, the cost per click is lower than in the Facebook feed, but there are more random clicks, which means that the number of refusals is higher (due to advertising in applications). Therefore, it is recommended to separate placements:
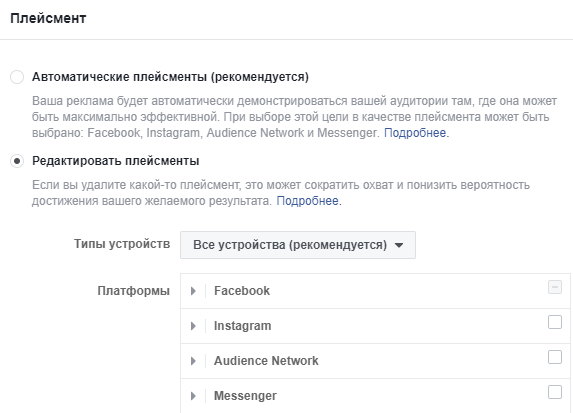
In addition, by separating Instagram, you can get clicks almost for pennies, especially if you have high-quality and vivid content. Instagram advertising is young. Despite the fact that it is built on the basis of Facebook, there is a clear feeling that it works less stable and less accurate.

2. Facebook is problematic, it’s hard to maintain:
2.1 Facebook has fewer automatic tools than Yandex.Direct and Google Adwords. The built-in Facebook Power Editor tool is not very convenient, it slows down and not everything can;
2.2 even if you select the geo-targeting “Moscow”, users from another country may click on your ad. As Facebook replied, they are tourists who are currently in Moscow. To exclude users from other countries, it is sometimes necessary to specify a target language - Russian in the audience settings:
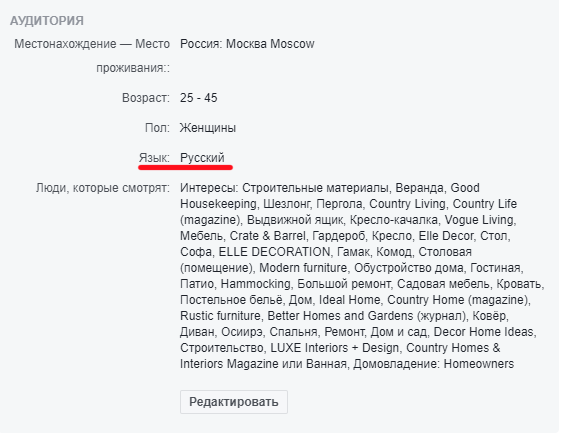
There is also such a thing as clicking bots, you also need to deal with this;
2.3 when copying a large ad group or for any other strange reason, Facebook may turn off and you will lose the work done;
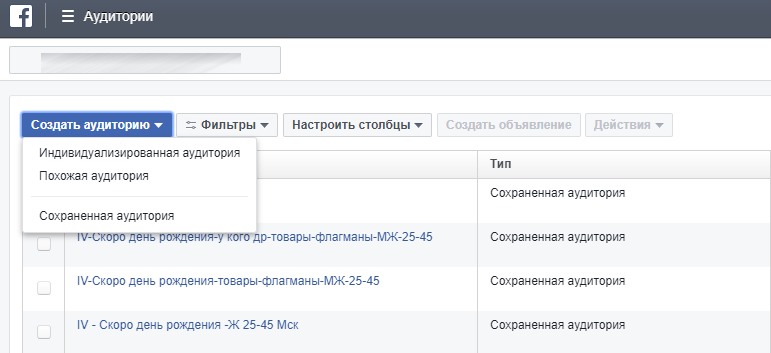
2.4 audience is best created from scratch through the Audience section. As when copying ad groups of the same type, if you need to expand the audience and keep it as new, problems arise. The audience may not be saved as new and not displayed in the general list of audiences:
2.5 Facebook has no official Russian technical support. In order to achieve consideration of the application (blocked an account due to user complaints, an ad mistakenly does not pass moderation, etc.) sometimes it takes days, and you need to know where to write: standard help forms of the help center often provide only an auto answer. Sometimes they answer only when you write in English.
We appeal to foreign support, there are friendly responsive guys, though they speak broken English.
Facebook, like Instagram, is a brave new world. It is difficult, but it can give a really good result.
We recommend trusting its setting to professionals. Otherwise, it can be mistakenly concluded that this channel does not work, although perhaps not everything is taken into account in the settings. Facebook and Instagram, in our experience, gave a good response in medical subjects and in the field of business services and literature.
By the way, how about an idea to try this tool? Contact us if you want to get a personal offer.
This article was translated automatically. We are working over improving the translation.
Please send your questions about the article to info@intervolga.ru- 30.04.2019
-
Olga Kolodina
-
Alisa Erofeeva