

Online store profitability calculation
This article was translated automatically. We are working over improving the translation.
Please send your questions about the article to info@intervolga.ru
A rough assessment of the effectiveness of an online store. Payback Model
What formulas to calculate the conversion of sales in the online store? Almost a year ago I wrote an article about the payback of an online store. This article has surprisingly become popular and has collected more than 500 responses from people who have used the proposed calculation model.
We handed out this model in Excel to everyone who wanted to make a profitable online store. They could enter basic parameters and get an estimate of the payback period. This made it possible to select profitable niches for the online store.
We continued to work on the analysis of the online store and today we present to you our new development - Calculator of profitability of an online store.
The calculator is a big step forward compared to the predictive payback model. It is focused on the analysis of new business and successfully predicts payback, although it has several limitations:
-
it is considered that the store sells one type of goods with one mark-up;
-
does not take into account the impact of sales on warehouse costs;
-
the model operates with specific types of advertising, almost without considering the long-term effect.
The model allowed many customers to evaluate the financial prospects of the online store. It is important that the model paid attention to significant phenomena and parameters that are often forgotten. For example, this:
-
the need to consider the cost of attracting customers and compare them with the profit from the online store;
-
the need to increase customer base and stimulate repeat sales;
-
a large positive impact of the physical store on online sales.
This model is applicable for most cases and works especially well when the store is not working and there is little data. The new calculator allows you to analyze a large amount of data and provides much more statistics and analytics.
How to run online sales?
Why create an online store? To raise sales, efficiency, profit.
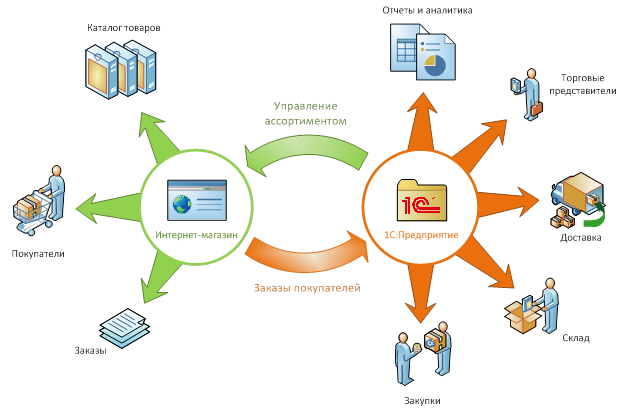
This project requires many interrelated competencies: development, marketing, analytics, automation of the sales process. All of this is web integration.
INTERVOLGA is a competent web integrator. We can solve all the problems of web integration on our own. Most of our projects are complex, integration.
We benefit the client’s business by making intelligent use of web technologies.
Usually we start the preparation of an integration project with a strategic SWOT analysis of information systems and advertising campaigns of the Customer.
Leave a request for consultation.
Calculator of profitability and increase in profitability of a working online store
So, you made a decision and opened your online store. We will help you analyze the situation, find bottlenecks and increase profitability.
Calculation of the profitability of the store. Maths
There are several formulas that we give and explain right away to tell you how the calculator works.
It is not necessary to delve into the analysis, everything is shown in diagrams, photographs and it is quite logical.
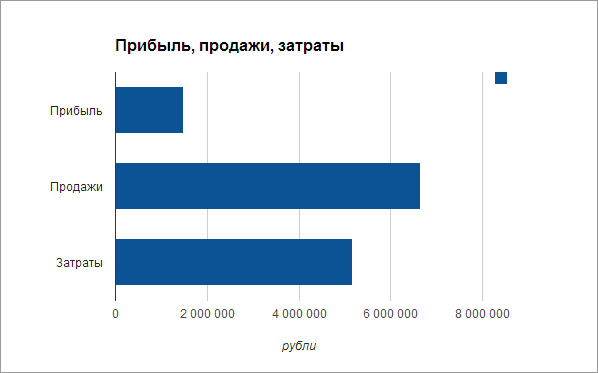
The traditional formula of online store profits is as follows:
Profit = Revenue -- Expenses
(Formula 1)
Revenue shows how much revenue the online store brings.
We consider the concept of expenses in 7 categories and have following
Expenses = Site + Storage + Advertising + Delivery + State+ Office + Services
(Formula 2)
Sales in the online store depend on attendance, average order (they also say: the average bill) and conversion.
Sales = Visits * Average order price * Conversion
(Formula 3)
Conversion is traditionally defined as the ratio of the number of purchases to the number of visitors.

What are the costs of an online store. Categories of expenses
The purpose of this article is to systematize knowledge about how an online store works, and to automate basic calculations: profitability, payback, conversion, advertising efficiency.
What happens a few months after launching an online store?
Orders are coming, delivery is working. Every day you receive and issue money, work with a bank and a cashier, pay and issue invoices.
Every day you make decisions.
We collect all cost categories, analyze sales and evaluate the effectiveness of online trading.
Cost categories:
-
Site
-
Support, site development: programming, design
-
Content: photos, reviews, articles
-
Domain Hosting
-
Backup, accessibility monitoring
-
Storage
-
Stock planning and creation (purchase or production)
-
Rent, insurance, security, transportation. People and equipment
-
Advertising
-
Internet advertising, banners, newsletters
-
Offline advertising
-
Delivery
-
Physical stores
-
Points of issue
-
Self-delivery
-
State
-
Taxes
-
Pension contributions
-
Permits, licenses
-
Office
-
Head
-
Accountant
-
Manager
-
Advertising Analyst
-
Services
-
Delivery
-
Payment systems, commission
-
Loans and investors
All this needs to be calculated and analyzed.
How to understand if your online store is profitable? Of course, you have an accountant and accountant. Maybe even in 1C. But in our country it somehow happened that small and medium-sized businesses use accounting to fool the state into tax reporting, and real accounting for profits and losses and trend analysis are carried out in other programs.
Excel or equivalent is most often used for this. In this article we will show how we consider it convenient and correct to analyze advertising, sales, current expenses and what interesting analytics you can build on this.
Decisions need to be made on the basis of qualitative analysis of reliable data.
Products. Online Store Assortment

What is important in matters of assortment:
-
It is better to sell the goods in sets and constantly work to ensure that at one time you buy as many product units as possible for the largest possible amount (increase in the average bill). This reduces all types of operating expenses, while maintaining profit.
-
So you can increase online store sales and make it profitable.
-
It is rarely possible to work at all without warehouse or demonstration stocks. Most likely, you will need a certain amount of goods. Sometimes you have to pay for this item in advance.
-
Margin for the sale of goods in the online store - the most important parameter. Depending on the industry where you work, it can be different: from 15 to 300%.
-
Arithmetically, the markup is related to the cost price and the retail price of the goods by a simple formula
-
The most important task is the planning of the range and effective inventory management. Many technologies are used for this, for example, analyzing the range of competitors and comparing it with the demand on the Web.
Markup = (Price - Cost Price) / Cost Price
(Formula 4)
The profitability calculator has the tools to account for the range of products:
-
Created 5 product groups.
It can be product groups, price ranges, types of buyers.
For example, if you sell bicycles wholesale and retail, you can enter them as 2 product groups with different average price and mark-up.
If 5 groups are few, you can add more by copying the lines.
-
For each group of goods is introduced:
- average price;
- average markup;
- required inventory (inventory can be calculated based on demand, delivery speed and logistics features, but the Calculator does not do this, the value is required to be entered).
|
Number |
Group Name |
Average Price, RUR |
Markup, % |
Stock, pieces |
|
1 |
Group 1 |
800 |
200 |
30 |
|
2 |
Group 2 |
2,500 |
40 |
10 |
|
3 |
Group 3 |
16,000 |
20 |
3 |
|
4 |
Group 4 |
4,000 |
40 |
8 |
|
5 |
Group 5 |
8,000 |
30 |
2 |
How and where the parameters of the goods are applied:
-
The average price is used to calculate the cost of inventory.
-
Margin is used when calculating the cost of goods in Formula 4.
-
Stocks.
-
If you need demo samples or warehouse.
The cost of the online store website
Site costs are counted by category:
-
Support, site development: programming, design. In general, site quality is one of the key ways to reduce headaches for a store owner. A good website will help you; a bad website will lead to losses of money and customers.
-
Choosing a company to develop and maintain a site is the most important thing.
-
If you are fine with this, then you belong to a happy minority.
-
If something is wrong with the site, we are ready to take on:
- the development of an online store;
- audit of the quality of the program code;
- technical and content support of the online store on Bitrix;
-
Content: photos, reviews, articles.
-
Domain Hosting.
-
Backup, accessibility monitoring.
|
|
Q1 |
Q2 |
Q3 |
Q4 |
|
Technique: programming, design |
60,000 |
60,000 |
60,000 |
60,000 |
|
Content: photos, reviews, articles |
10,000 |
10,000 |
10,000 |
10,000 |
|
Домен, хостинг, продление аренды или лицензии |
5,000 |
6,138 |
0 |
0 |
|
Backups, monitoring accessibility |
300 |
300 |
300 |
300 |
Website promotion is related to advertising, and not to the cost of the website.
Logistics and warehouse online store. Production, procurement, storage costs
The question of the warehouse all online shops decide in different ways. This may be the corner in your apartment or a huge automated warehouse complex. It is important to calculate the costs and draw conclusions.
The cost of the warehouse includes:
-
the cost of the purchase or production of goods, maintaining stock;
-
the cost of maintaining a physical warehouse - rent, heating, security, transportation. Equipment and people.
How are the costs for the purchase or production of goods, the maintenance of stock:
-
When calculating the cost of a warehouse, the cost is calculated according to Formula 4 according to the data entered in the description of the Goods.
-
It takes into account the cost of inventory, which you indicated as necessary when describing product groups.
-
The cost of maintaining inventory is calculated from sales (see below).
The cost of maintaining a physical warehouse depends on the specifics. The model contains three types of storage costs:
-
permanent (for example - rent),
-
cost dependent (example - insurance),
-
variable costs that you can specify arbitrarily.
|
|
Stock, pieces |
Q1 |
Q2 |
Q3 |
Q4 |
|
Receipt of goods (purchase or production) |
|
|
|
|
|
|
Group 1 |
8,000 |
2,480 |
2,213 |
4,747 |
6,987 |
|
Group 2 |
17,857 |
20,357 |
13,750 |
29,643 |
68,750 |
|
Group 3 |
40,000 |
36,000 |
104,000 |
170,667 |
440,000 |
|
Group 4 |
22,857 |
14,286 |
37,714 |
61,429 |
83,429 |
|
Group 5 |
12,308 |
72,615 |
67,692 |
116,308 |
179,077 |
|
Warehouse maintenance costs |
|
|
|
|
|
|
|
15,000 |
15,000 |
15,000 |
15,000 |
|
|
1,457 |
2,254 |
3,828 |
7,782 |
|
|
0 |
0 |
0 |
0 |
Calculator restrictions. It does not take into account:
-
possible deferment of payments for the goods;
-
that a part of the goods will not be bought up and will be permanently stored in the warehouse;
-
shelf life of goods;
-
that different batches of goods can come at different prices.
In addition, there are no ready accounting tools:
-
seasonality (heating radiators purchased at the end of winter will last until autumn);
-
sets, sets, gifts;
-
the mutual influence of sales of different groups of goods (for example, with the growth of sales of electric drills, sales of extenders and drills grow).
Accounting for these features can be added, but we still do not consider it necessary.
We make a convenient tool, while maintaining its simplicity.
If the product costs you nothing (for example, you sell ringtones purchased once) and store it free (included in the hosting price), then the tab can be turned off entirely. Warehouse costs will not be counted at all.
Advertising and marketing online store. Analyzing sales in the online store
Advertising, marketing, attendance and sales in the online store - the basis of the Calculator. In these aspects, it is fundamentally different from the first generation of the online store's payback model. It used a very simple calculation scheme for advertising and sales.

This scheme included the following:
-
Advertising budget was considered permanent forever.
-
Introduced the average cost of a visitor from each advertising channel. This average cost was also considered constant.
-
The calculations used a constant conversion of the online store.
-
The resale price was taken constant and was calculated artificially.
-
The input parameter was the indicator of repeat sales for those who bought at least once.
The advantage of such a scheme is the ability to evaluate efficiency without going into details.
For the forecast and evaluation of the benefits of creating an online store, this model fits well.
In reality, everything is much more complicated.
After evaluating the effectiveness of the future store, creating a website and starting sales, the following happens:
-
The manager plans and conducts a series of promotional activities using various channels.
-
Constantly analyzing the impact of advertising on sales.
-
Such an analysis should be conducted by an experienced person for whom your online store is not the first. We highly recommend that you find a thoughtful analyst or use our service to audit advertising campaigns and increase conversion.
-
Sales come through different channels.
-
Store conversion is constantly changing. The reasons are changes in the design, assortment, prices, speed of the site, the quality of advertising campaigns, position in search engines, the accumulation of customer base.
If the store is constantly working with a certain advertising channel, the cost of attraction will not be unchanged. Well, if it is constantly decreasing.
The new version - Yield Calculator - is designed to assess the effectiveness of a working online store. Independent actual accounting is maintained:
-
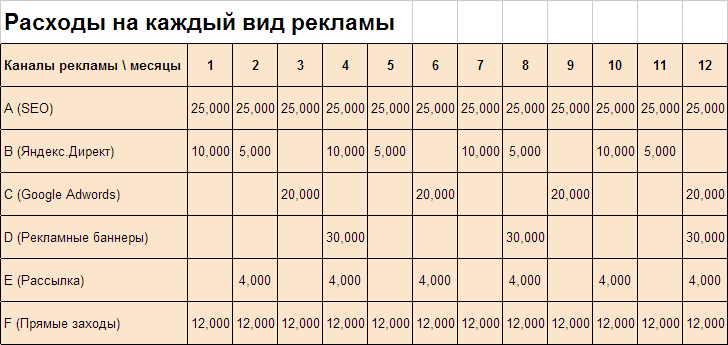
Investment in advertising by channel (enter actual data);
-
You need to know how much and when you spent money on each type of advertising;
-
You can specify any of your own types of advertising channels, the calculator does not make a fundamental difference between them;
-
Direct calling costs are recorded as the cost of activities aimed at maintaining customer loyalty;
-
Each direct call is someone's recommendation;
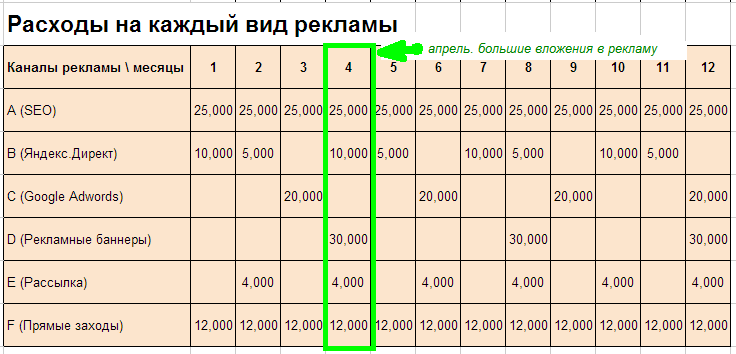
Cost of every advertising channel by months
-
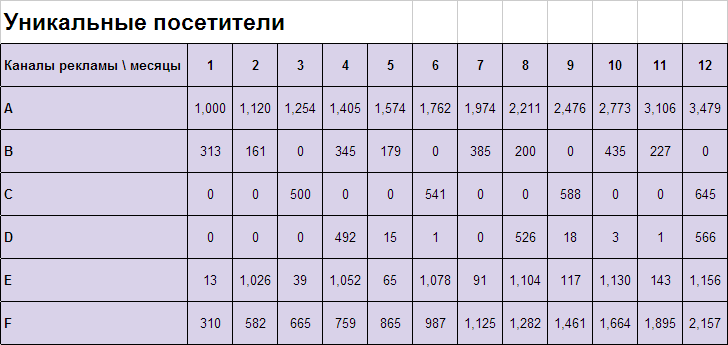
Attendance (actual data entered);
-
Attendance data should be taken from the analytics of the meters that you have installed;
Unique visitors in channels by months
-
Sales by product groups and advertising channels (statistics on actual sales):
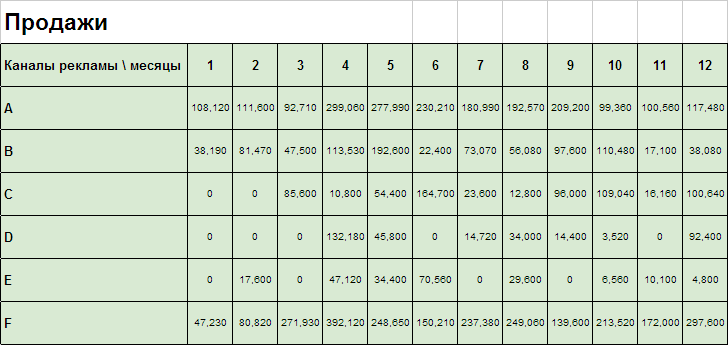
We will dwell on the last table “Sales” in detail, it is of key importance. These data are very desirable not to enter your hands yourself. This table is built automatically based on primary sales data (see below).
On the basis of the input data, the parameters are calculated:
-
visitor cost by channels;
-
decrease or increase of conversion by channels and by time;
-
evaluation of the effectiveness of advertising channels (taking into account the entire life cycle of the buyer).
A qualitative analysis of reliable data will help make a decision. About what conclusions and how does the calculator, we will tell later.
Building a table of sales by month in the sections of advertising channels. Online Store Profitability
Monthly sales table needs to be built using actual sales data from the accounting system (1C), site management (CMS; for example, 1C-Bitrix Business System edition) or web analytics (for example, Google Analytics).
Key to the analysis is the channel (source) of the sale. The accumulation of this information may present certain difficulties for some online stores.
This problem can be solved, for example, using Bitrix web analytics or a special software module.
Based on the initial data on actual sales, the following model parameters are recalculated:
-
data on the cost of the warehouse;
-
visitor cost and conversion calculations;
-
conclusions on the effectiveness of advertising channels;
-
expenses for employees receiving bonuses on sales.
The primary information is a table of this structure:
|
Date of registration |
Channel |
Order Date |
Group |
Sum |
|
1-Jan-2013 |
A |
28-Mar-2013 |
Group 1 |
1,600 |
|
1-Jan-2013 |
B |
1-Jan-2013 |
Group 2 |
2,750 |
|
1-Jan-2013 |
B |
5-Apr-2013 |
Group 3 |
19,200 |
|
1-Jan-2013 |
F |
1-Jan-2013 |
Group 4 |
12,000 |
|
5-Jan-2013 |
A |
5-Jan-2013 |
Group 5 |
21,600 |
|
9-Jan-2013 |
A |
9-Jan-2013 |
Group 1 |
1,920 |
Please note that each order, regardless of when it was made, must be assigned to a specific advertising channel. For further analysis, the group of goods and the amount of the order are also put down.
The data of such a structure you need to get from programmers, analysts or accountants. If you are unable to collect data on the Advertising Channel and Product Group - leave these columns empty. Profitability will be calculated, but most of the most interesting analytics will be absent.
In the example, which is used in the article, information on more than 600 orders totaling more than 6 million rubles is presented.
Cohort analysis and conclusions of advertising channels. We are looking for ways to increase sales in the online store
The section is based on Alexey Kulichevsky's articles on cohort analysis.
Based on primary sales data in the online store, it is useful to conduct a cohort analysis.
A cohort analysis allows you to analyze the long-term effectiveness of an online store from each:
advertising channel;
months of advertising;
type of product.
A cohort is a group of buyers who have registered in a specific month from a certain advertising channel.
Such an analysis can be built in any program like Microsoft Excel (consolidated report), Google Docs (pivot table report), Apple Numbers (Pivot Table).
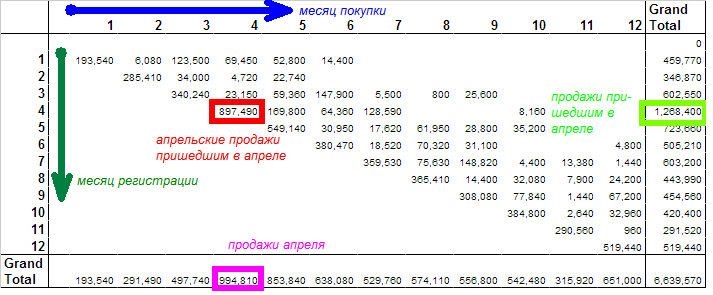
The figure above shows a cohort analysis of all sales for the year.
For example, take April. This month in our example has a large investment in advertising. How to understand how much money this month will bring us?
The cost of each type of advertising.
What are the results ?
-
At first glance, you need to take April sales. This number is highlighted in purple and is 994,810 RUR .
If you look closely, these sales also take into account those buyers who came earlier from other advertising channels and budgets and their purchases are in no way connected with April advertising.
This is the wrong way to evaluate the effectiveness of April advertising.
-
You can cut off those who registered before April and leave those who registered and bought in April. This number is highlighted in red and is 897,490 RUR .
At the same time, as we understand, advertising continues to work after the end of April and those who came to us this month will buy something later.
This is also the wrong way to evaluate the effectiveness of April advertising.
-
The surest way is to see all purchases, for the entire observation period, from customers who came to us in April. This number is highlighted in green and is a record 1,268,400 RUR .
Please note that by the end of the year, people who came to the site in April, almost stopped buying. This phenomenon corresponds to the life cycle of the buyer.
The value we calculated, highlighted in green, is called the life cycle revenue for buyers who arrived in April (CLV = Customer Lifecycle Value).
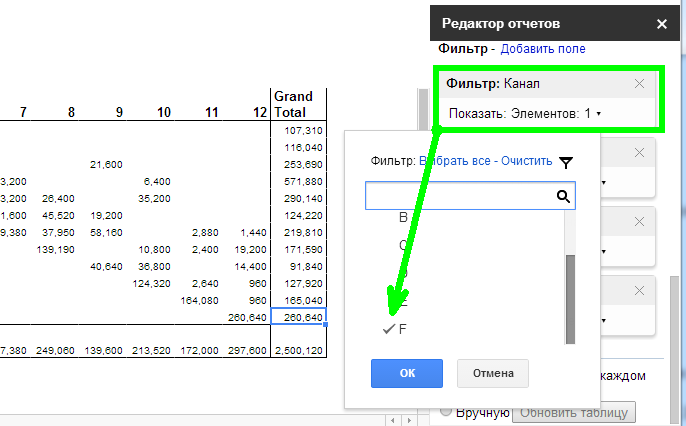
Cohort sales analysis allows you to filter data by one advertising channel or one group of products and go into details. For example, this is the summary report for the year on the channel “Direct visits, recommendations”.
Shipping, delivery and physical stores costs
Shipping, physical stores and points of issue of goods are very useful for improving the efficiency of online trading. It is psychologically easier for the buyer, without making prepayments and without risking anything, to wait for the courier or to come to the real store for the goods. At the same time, service, convenience, clarity and unobtrusiveness of an online store stimulate choice, sales, pleasure.
The payback calculator allows you to take into account the cost of shopping, delivery and points of issue by category:
-
expenses for shops (rent and salary, for example);
-
the cost of the point of issue of the goods (payments for use of the point, if it does not belong to you, salary);
-
home-made delivery is divided into courier transportation and labor;
If you separately consider payment for delivery in each order and are sure that everything is correct, you can delete the delivery costs.
-
You can additionally specify your costs depending on the amount of delivery (premium courier, for example).
|
|
Q1 |
Q2 |
Q3 |
Q4 |
|
Physical stores and points of issue |
|
|
|
|
|
Store 1 |
30,000 |
30,000 |
30,000 |
30,000 |
|
Store 2 |
0 |
0 |
0 |
0 |
|
Store 3 |
0 |
0 |
0 |
0 |
|
Point of issue 1 |
3,000 |
3,000 |
3,000 |
3,000 |
|
Point of issue 2 |
0 |
0 |
0 |
0 |
|
Self-delivery |
|
|
|
|
|
fixed (salary) |
60,000 |
60,000 |
60,000 |
60,000 |
|
depending on the value of the goods (premium) |
2,948 |
7,460 |
4,982 |
4,528 |
|
variables (transport) |
10,000 |
10,000 |
10,000 |
10,000 |
In the table above, the courier receives a premium of 0.3% of the value of the goods delivered by him.
State. Taxes, pension contributions, licenses and permits
Taxation online store is a big topic that can be considered in detail. As part of the compilation of the payback model, it is necessary to take into account all possible types of expenses.
This item of expenditure does not affect sales and is inevitable.
The calculator takes into account:
-
fixed costs;
-
expenses depending on sales;
-
difficult to calculate expenses (for example, income tax) that must be entered after the fact.
|
|
Q1 |
Q2 |
Q3 |
Q4 |
|
Taxation of turnover |
|
|
|
|
|
6% |
58,966 |
149,204 |
99,640 |
90,564 |
|
Fixed payments (pension fund, license) |
|
|
|
|
|
fixed (payroll taxes) |
15,000 |
15,000 |
15,000 |
15,000 |
|
variables |
0 |
0 |
0 |
0 |
If you enter a turnover tax rate, it will be multiplied by your quarterly sales and will show tax deductions.
We recommend working legally and paying taxes. The online store, although partially located in the virtual space, is accessible to checks almost as much as the real one. Being engaged in trading activities in the territory of the Russian Federation, although through the Internet, your store is subject to all the same laws as the real store “at the bus stop”.
Office. Rent, salary, bonuses
An online store, in addition to or instead of points of issue of goods, may have an office. Our model allows you to take into account the cost of rent, communications, transportation and on staff salaries.
It is possible that you do not have office rental costs and the only employee is you.
It may also turn out that you have several dozen employees developing the site, leading the work of supporting customers and arranging delivery.
The calculator allows you to take all this into account in the cost structure.
|
|
Rate by month |
Q1 |
Q2 |
Q3 |
Q4 |
|
Rent |
10,000 |
30,000 |
30,000 |
30,000 |
30,000 |
|
Overhead (cleaning, internet, telephone) |
8,000 |
24,000 |
24,000 |
24,000 |
24,000 |
|
Salary |
|
|
|
|
|
|
Leader of Sales Managers |
0 |
0 |
0 |
0 |
0 |
|
Manager (% of sales) |
3% |
29,483 |
74,602 |
49,820 |
45,282 |
|
Acountent |
5,000 |
15,000 |
15,000 |
15,000 |
15,000 |
|
Sales Manager |
10,000 |
30,000 |
30,000 |
30,000 |
30,000 |
|
Sales Manager (% of sales) |
2% |
19,655 |
49,735 |
33,213 |
30,188 |
|
Advertising specialist & Analyst |
15,000 |
45,000 |
45,000 |
45,000 |
45,000 |
Bank services, investor relations, delivery and commissions of payment systems
A number of tasks can be solved both by employees of the store (then they are taken into account in the categories Office or Delivery), and entrusted to external companies. In this case, we categorize them as Services.
If you separately consider payment for delivery in each order and are sure that it pays off, you can remove the delivery costs.
Services also include expenses on commissions of payment systems, relations with the Bank, where a loan was taken, or other investors.
|
|
|
Q1 |
Q2 |
Q3 |
Q4 |
|
Delivery |
Costs by month |
|
|
|
|
|
branch 1 |
8,000 |
8,000 |
8,000 |
8,000 |
8,000 |
|
branch 2 |
20,000 |
20,000 |
20,000 |
20,000 |
20,000 |
|
Payment systems - % of return |
% of the payments |
|
|
|
|
|
4% |
10% |
3,931 |
9,947 |
6,643 |
6,038 |
|
8% |
40% |
31,449 |
79,575 |
53,141 |
48,301 |
|
|
monthly consumption |
|
|
|
|
|
Bank |
0 |
0 |
0 |
0 |
0 |
|
To investor |
0 |
0 |
0 |
0 |
0 |
How the payback calculator is implemented
The calculator of profitability and profitability described in the article is implemented as a table in Google Docs. It can easily be opened in Microsoft Excel or Apple Numbers.
The open structure of the document allows you to both upload your primary data on sales and expenses and get analytics, as well as make any changes.
The calculations are distributed on 11 sheets: goods, 7 categories of costs, sales and cohort analysis, and summary analytics.
How to work with a calculator. Accounting and forecasting modes of operation
Accounting and analytics
A simple and correct way to work includes:
-
uploading to the Sales list the actual sales of the online store;
-
enter attendance;
-
indication of real expenses;
-
gradual accumulation of data for analysis;
-
obtaining initial and final findings on data analysis.
Our calculator can be a working paper for those who manage their online store and have no other way of management accounting.
Forecast mode
For the forecast mode, we recommend using the payback calculation model. It is simple and usually suffices. But if you like the calculator, but you don’t have a store yet, you can enter estimated costs and sales data, indicate possible cost categories.
You can use the calculator as a predictive model. All calculations will be made correctly, although due to the lack of real data the analyst will be very conditional.
Evaluation of the effectiveness of an online store
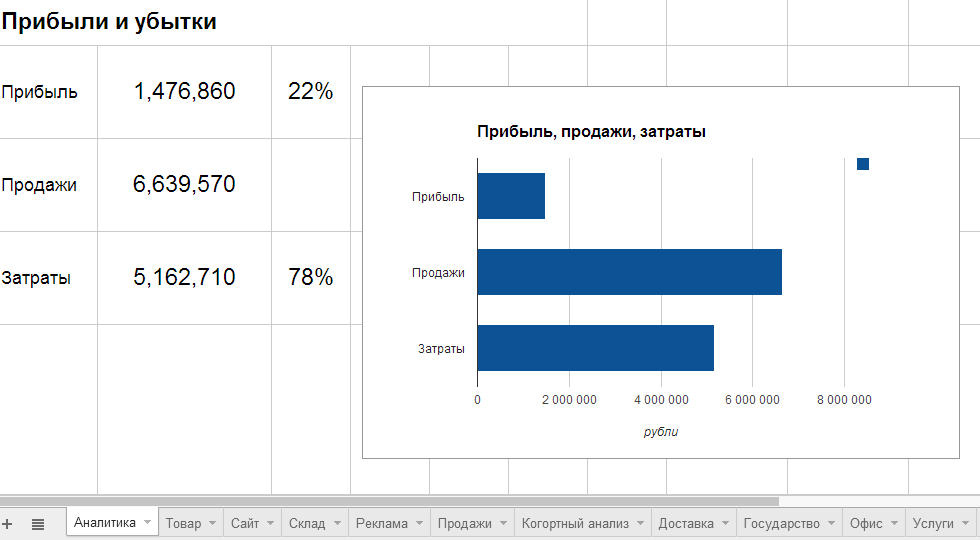
The calculator counts all the main indicators for evaluating the effectiveness of an online store, provides tables and graphs.
For the initial analysis of this is enough, any more detailed reports can be obtained using the capabilities of charts and formulas.
Online Store Profit
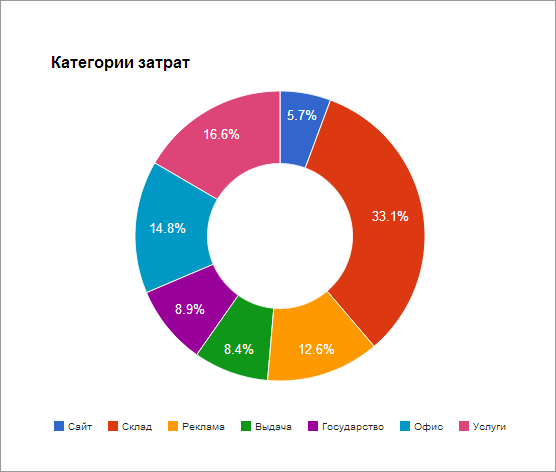
Cost categories
Cost elements are presented in a pie chart.
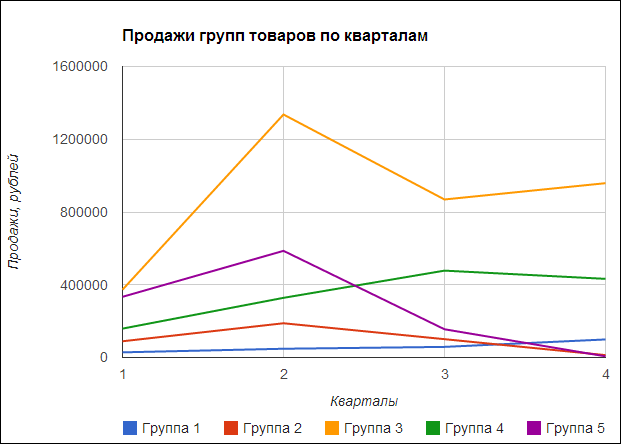
Sales of product groups
The diagram shows the sales of goods by groups in the dynamics by quarter.
Visitor's cost
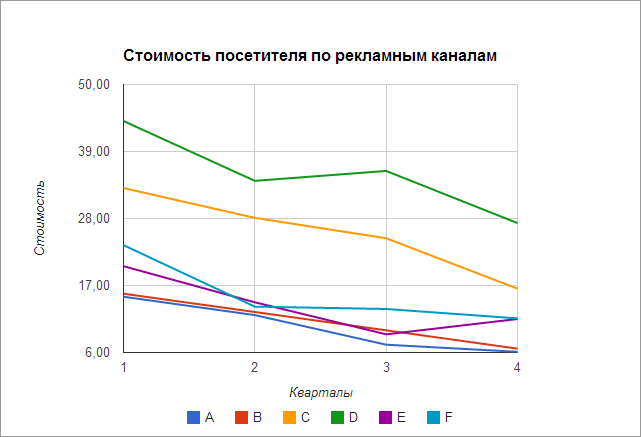
Visitor cost is an indicator that is useful to compare for old and new advertising channels. Visitors and their quality mean a lot to sales growth.
Cost of sale
The chart shows the cost of a single sale by quarter and advertising channels.
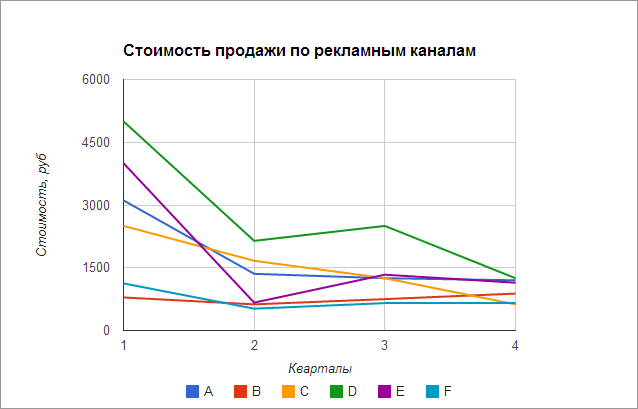
The cost of sales should gradually decrease and in the long run should be significantly less than the average order markup.
Online Store Conversion
The chart shows the conversion by quarter and advertising channels.
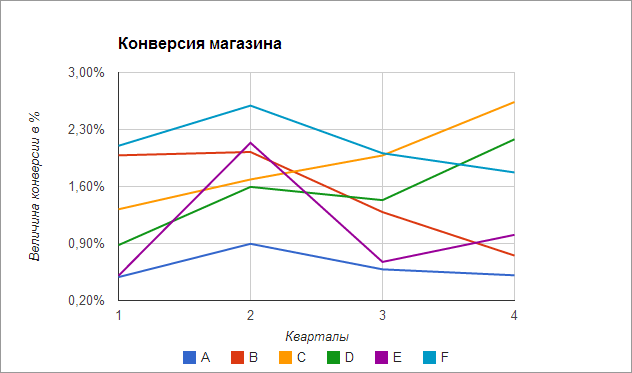
The average conversion in the example is 1.1%.
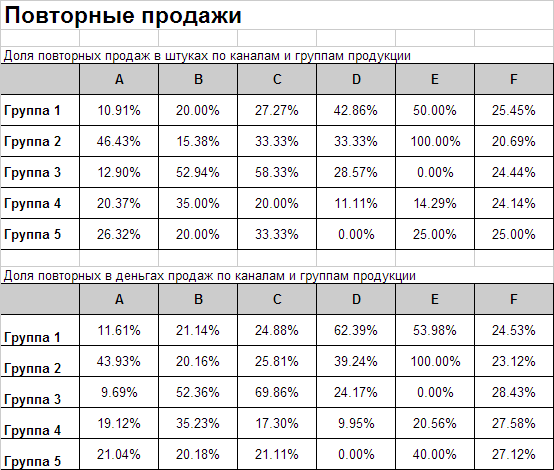
Re-sales by product groups and advertising channels
The report table shows how many % of sales in units and in money are repeated.
Conclusions
The use of a calculator allows you to get answers to the questions:
-
What type of advertising is most beneficial for an online store in terms of quick effect? repeat sales? attendance growth?
-
which product group enjoys the greatest demand from repeat buyers?
-
What types of advertising channels should be discarded due to their disadvantage?
-
How do promotions and changes on the store site affect the conversion?
-
What types of costs take up too much of the total?
-
What is the profitability of the online store in general?
… and many others.
We wish you have reliable information, analysis tools and confidently make the right decisions.
I want to count! How to get a model and calculator?
We provide a model for calculating payback to everyone for free. To receive it, you only need to specify your name, contact mail and the direction of the online store that you want to calculate in the comments on the article on the model. To obtain calculations, you need to enter about 15 basic parameters.
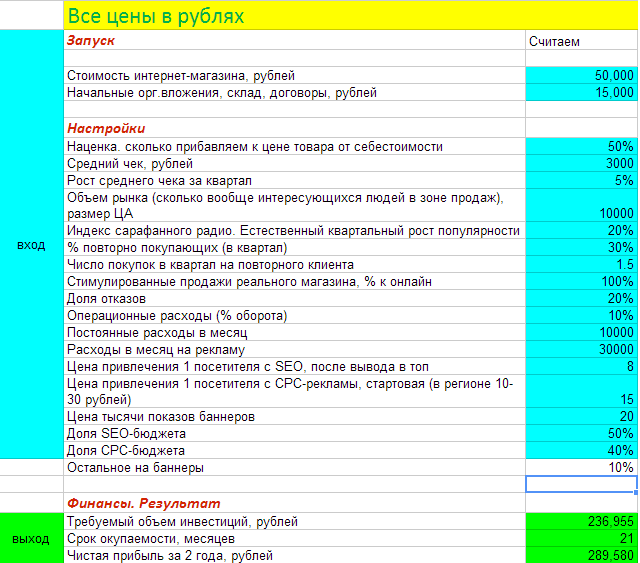
As for the calculator, everything is more complicated. In order to get a real picture of it, you need to enter several hundred indicators, download data on real sales. Most likely, some formulas will have to be edited: delete something, add some features of your online store. A calculator is a complicated thing, its application requires an understanding of the principles laid down, the ability to read and change formulas, and experience.
Calculator - like a fighter cockpit, do not take off without an instructor.
Therefore, we provide an online store profitability calculator with only 2 hours of personal consultations from its developer, Stepan Ovchinnikov. During the consultation, the calculator will be adapted for you.
A copy of the calculator and 2 hours of consultation cost 4000 rubles.
There are several ways to get a calculator and consultation for free, complete with our other services:
-
order an audit of an online store advertising campaign or a conversion conversion service;
-
order a technical audit of the quality of the site;
-
order a new online store or enter into an agreement to support the online store at the L tariff.
Thanks for reading, we know that it was not easy.
Why do you need INTERVOLGA in this project?
INTERVOLGA is a competent web integrator. We can solve all the problems of creating an online sales system on our own.
We benefit the client’s business by making intelligent use of web technologies.
Usually we start the preparation of an integration project with a strategic SWOT analysis of information systems and advertising campaigns of the Customer.
Leave a request for consultation.
This article was translated automatically. We are working over improving the translation.
Please send your questions about the article to info@intervolga.ru
- 15.07.2019
-
Stepan Ovchinnikov